Contents
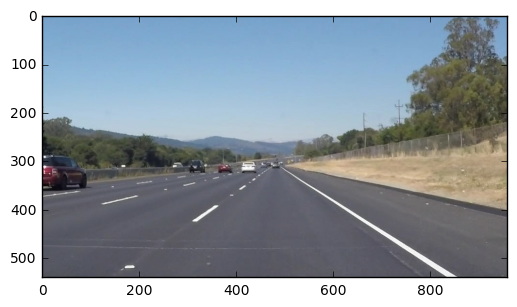
这是 Udacity 无人驾驶课程的笔记。第一个作业是检测车道,简单地说就是把路面上的行车线找出来。

环境准备
这个作业需要有 Anaconda 的环境,然后装上 jupyter notebook, OpenCV 等必要的库。
具体的安装方法可参考(fork 自 Udacity):
https://github.com/feichashao/CarND-Term1-Starter-Kit/blob/master/doc/configure_via_anaconda.md
其中,安装 tensorflow 的时候,可能会遇到 Google 被墙的情况,所以安装的时候最好先挂个代理,在安装前设置环境变量, 比如:
# export http_proxy=http://8.8.8.8:5187/
# export https_proxy=$http_proxy
颜色选择(Color Selection)
颜色是区分行车线的其中一个因素。对于一种颜色,可以有不同的编码方式,常见的是RGB,YUV等。
由于行车线的颜色与周围环境有一定区分,我们可以对RGB分别设定阈值,把有用的信息分离出来。
### Source: Udacity CarND Term1 Lesson 1 Section 4.
import matplotlib.pyplot as plt
import matplotlib.image as mpimg
import numpy as np
%matplotlib inline

image = (mpimg.imread('test.jpg')).astype('uint8')
print('This image is: ',type(image),
         'with dimensions:', image.shape)

# Grab the x and y size and make a copy of the image
ysize = image.shape[0]
xsize = image.shape[1]
color_select = np.copy(image)

# Define color selection criteria
###### MODIFY THESE VARIABLES TO MAKE YOUR COLOR SELECTION
red_threshold = 195   ### <-----
green_threshold = 195 ### <-----
blue_threshold = 195  ### <-----
######

rgb_threshold = [red_threshold, green_threshold, blue_threshold]

# Do a boolean or with the "|" character to identify
# pixels below the thresholds
thresholds = (image[:,:,0] < rgb_threshold[0]) \
            | (image[:,:,1] < rgb_threshold[1]) \
            | (image[:,:,2] < rgb_threshold[2])
color_select[thresholds] = [0,0,0]
plt.imshow(color_select)
# Display the image
plt.imshow(color_select)
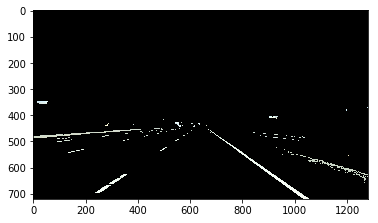
RGB每一个Channel对应的数值范围是 0~255,这里对 RGB 都设置了 195 为阈值,过滤后可以看到左右行车线。

区域选择(Region Masking)
从汽车的前置摄像头中,行车线通常都在图像下半部分的一个梯形区域内,所以在提取行车线的时候,只关注这个梯形区域内的图像,可以避免其他区域的信息造成干扰。这个梯形区域如果选取地太大,则会引入更多无关信息(比如护栏,树木等),如果梯形区域选取太小,则可能看不见行车线,所以这里需要权衡。
在练习题的例子中,使用了三角形来选取区域。
# Source: Udacity CarND term1 Lession 1 Section 7
import matplotlib.pyplot as plt
import matplotlib.image as mpimg
import numpy as np
%matplotlib inline

image = mpimg.imread('test.jpg')

# Grab the x and y size and make a copy of the image
ysize = image.shape[0]
xsize = image.shape[1]
color_select = np.copy(image)
line_image = np.copy(image)

# Define color selection criteria
# MODIFY THESE VARIABLES TO MAKE YOUR COLOR SELECTION
red_threshold = 195
green_threshold = 195
blue_threshold = 195

rgb_threshold = [red_threshold, green_threshold, blue_threshold]

# Define the vertices of a triangular mask.
# Keep in mind the origin (x=0, y=0) is in the upper left
# MODIFY THESE VALUES TO ISOLATE THE REGION
# WHERE THE LANE LINES ARE IN THE IMAGE
left_bottom = [130, 719]  ###<<-------
right_bottom = [1150, 719] ###<<-------
apex = [640, 400]     ###<<-------

# Perform a linear fit (y=Ax+B) to each of the three sides of the triangle
# np.polyfit returns the coefficients [A, B] of the fit
fit_left = np.polyfit((left_bottom[0], apex[0]), (left_bottom[1], apex[1]), 1)
fit_right = np.polyfit((right_bottom[0], apex[0]), (right_bottom[1], apex[1]), 1)
fit_bottom = np.polyfit((left_bottom[0], right_bottom[0]), (left_bottom[1], right_bottom[1]), 1)

# Mask pixels below the threshold
color_thresholds = (image[:,:,0] < rgb_threshold[0]) | \
                    (image[:,:,1] < rgb_threshold[1]) | \
                    (image[:,:,2] < rgb_threshold[2])

# Find the region inside the lines
XX, YY = np.meshgrid(np.arange(0, xsize), np.arange(0, ysize))
region_thresholds = (YY > (XX*fit_left[0] + fit_left[1])) & \
                    (YY > (XX*fit_right[0] + fit_right[1])) & \
                    (YY < (XX*fit_bottom[0] + fit_bottom[1]))

# Mask color and region selection
color_select[color_thresholds | ~region_thresholds] = [0, 0, 0]
# Color pixels red where both color and region selections met
line_image[~color_thresholds & region_thresholds] = [255, 0, 0]

# Display the image and show region and color selections
plt.imshow(image)
x = [left_bottom[0], right_bottom[0], apex[0], left_bottom[0]]
y = [left_bottom[1], right_bottom[1], apex[1], left_bottom[1]]
plt.plot(x, y, 'b--', lw=4)
plt.imshow(color_select)
plt.imshow(line_image)
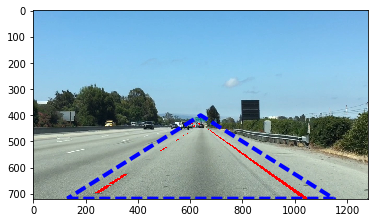
图中,蓝线是所选择的区域,红线是颜色过滤(Color threshold)得出的像素。
Canny 边缘检测(Edge Detection)
边缘检测也是一种检测行车线的手段。以灰度图为例,每个像素点的灰度数值在[0,255]区间,行车线的颜色通常与路面有较大差异,我们可以利用路面到行车线的颜色突变来进行检测。
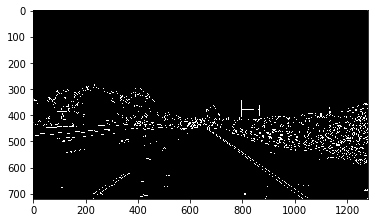
Canny edge detector 是其中一种边缘检测方法,在 OpenCV 中可以这样调用:
edges = cv2.Canny(gray, low_threshold, high_threshold)
Canny edge detector 的大致过程如下:
1. 首先会做一个 Gaussian filter 来除杂。
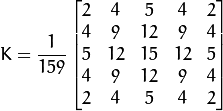
2. 然后会对 x,y 方向分别求梯度(gradient)。
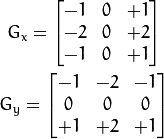
3. 综合x,y的梯度得出综合的梯度G。

4. 如果梯度G大于 high_threshold,就会认为它是边缘像素,保留这些像素;然后把所有低于 low_threshold 的像素去除,在 [low_threshold, high_threshold]之间的像素,如果它位置邻于高于 high_threshold 的像素,则保留,其余的去除。
low_threshold 和 high_threshold 通常的取值范围是 low:high 是 1:2 或 1:3.
具体参考:
http://docs.opencv.org/2.4/doc/tutorials/imgproc/imgtrans/canny_detector/canny_detector.html
# Source: Udacity Carnd term1 Lesson 1 Sector 11
import matplotlib.pyplot as plt
import matplotlib.image as mpimg
import numpy as np
import cv2
%matplotlib inline


image = mpimg.imread('test.jpg')
gray = cv2.cvtColor(image,cv2.COLOR_RGB2GRAY)  ## 转换成灰度图

# Define a kernel size for Gaussian smoothing / blurring
kernel_size = 5 # Must be an odd number (3, 5, 7...) ## 使用 5 作为 kernel size 来除杂。
blur_gray = cv2.GaussianBlur(gray,(kernel_size, kernel_size),0)

# Define our parameters for Canny and run it
low_threshold = 50  ## 设置高低 threshold
high_threshold = 120
edges = cv2.Canny(blur_gray, low_threshold, high_threshold)

# Display the image
plt.imshow(edges, cmap='Greys_r')
霍夫变换 (Hough Transform)
霍夫变换是一种以投票来检测线段的方式。它将图像从X-Y域转换到R-θ域,R是指X-Y域中像素点距离(0,0)的最短距离,θ是与X轴形成的角度。
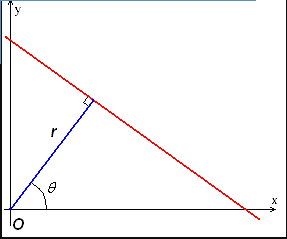
X-Y域的一个点在R-θ域是一条直线,X-Y域的一条线段上的点在R-θ域会相交到一个点,这个点反过来就是X-Y域的一条直线。 所以我们只要在R-θ域找到各线的交点,就能找到X-Y域的线。
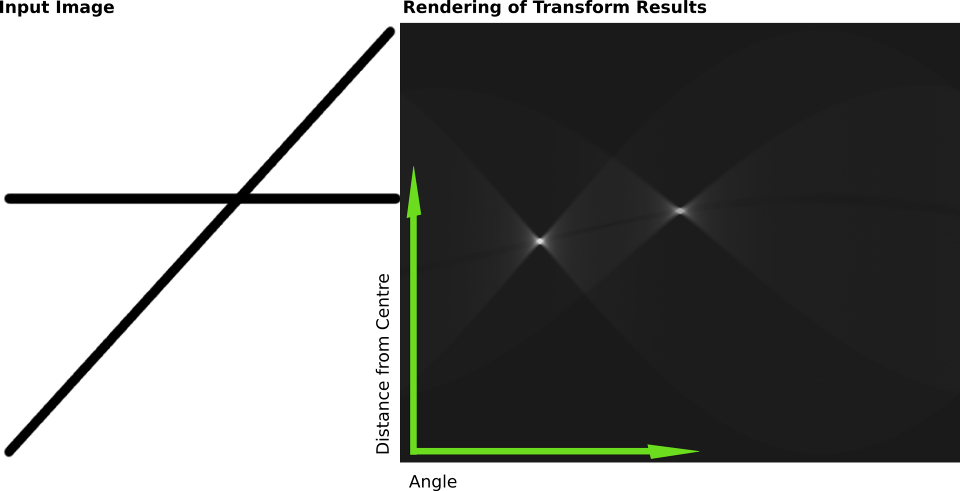
具体参考维基百科:
https://en.wikipedia.org/wiki/Hough_transform
在 OpenCV 中,可以通过如下方法来找到黑白图中的线段。黑白图是经过上面颜色和区域过滤得到的图像。
lines = cv2.HoughLinesP(edges, rho, theta, threshold, np.array([]), min_line_length, max_line_gap)
edges 是上面处理好的黑白图. rho 和 theta 表示距离(rho)和角度(theta)在R-θ中的分辨率,threshold 是指可以判断为一条线段所需的最小votes(R-θ中的有多少条直线相交于这一点), np.array([])是个placeholder不用在意,min_line_length指在X-Y域一条线段的长度最少是多少才认为是线段,max_line_gap是这条线段之间各个部分(segment)所允许的间隔(有多少个空缺点)。
# Source: Udacity CarND term1 Lesson 1 Sector 15
import matplotlib.pyplot as plt
import matplotlib.image as mpimg
import numpy as np
import cv2

image = mpimg.imread('test.jpg')
gray = cv2.cvtColor(image,cv2.COLOR_RGB2GRAY)

# Define a kernel size and apply Gaussian smoothing
kernel_size = 5
blur_gray = cv2.GaussianBlur(gray,(kernel_size, kernel_size),0)

# Define our parameters for Canny and apply
low_threshold = 50
high_threshold = 150
edges = cv2.Canny(blur_gray, low_threshold, high_threshold)

# Next we'll create a masked edges image using cv2.fillPoly()
mask = np.zeros_like(edges)
ignore_mask_color = 255

# This time we are defining a four sided polygon to mask
imshape = image.shape
vertices = np.array([[(0,imshape[0]),(450, 290), (490, 290), (imshape[1],imshape[0])]], dtype=np.int32)
cv2.fillPoly(mask, vertices, ignore_mask_color)
masked_edges = cv2.bitwise_and(edges, mask)

# Define the Hough transform parameters
# Make a blank the same size as our image to draw on
rho = 2 # distance resolution in pixels of the Hough grid
theta = np.pi/180 # angular resolution in radians of the Hough grid
threshold = 15     # minimum number of votes (intersections in Hough grid cell)
min_line_length = 40 #minimum number of pixels making up a line
max_line_gap = 20    # maximum gap in pixels between connectable line segments
line_image = np.copy(image)*0 # creating a blank to draw lines on

# Run Hough on edge detected image
# Output "lines" is an array containing endpoints of detected line segments
lines = cv2.HoughLinesP(masked_edges, rho, theta, threshold, np.array([]),  ###<<-------
                            min_line_length, max_line_gap)

# Iterate over the output "lines" and draw lines on a blank image
for line in lines:
    for x1,y1,x2,y2 in line:
        cv2.line(line_image,(x1,y1),(x2,y2),(255,0,0),10)

# Create a "color" binary image to combine with line image
color_edges = np.dstack((edges, edges, edges))

# Draw the lines on the edge image
lines_edges = cv2.addWeighted(color_edges, 0.8, line_image, 1, 0)
plt.imshow(lines_edges)
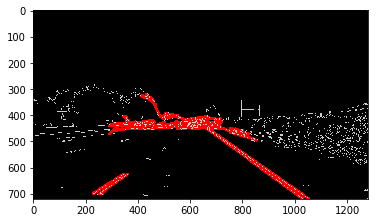
Project 1 - Finding Lane Lines on the Road
万事具备,可以写作业了。这个作业的最终目的是提取出视频中的行车线。视频也是由一帧帧的图像组成的,所以只要做好了对单张图片的pipeline,也可以将其应用到视频上。
完整源码请见:
https://github.com/feichashao/CarND-LaneLines-P1/blob/master/P1.ipynb
准备工作
首先的首先是导入所需要的库:
#importing some useful packages
import matplotlib.pyplot as plt
import matplotlib.image as mpimg
import numpy as np
import cv2
%matplotlib inline
然后是一些 helper functions:
import math

def grayscale(img):
    """
    功能:将 img 从彩色图像转换成灰度图像。
    mpimg.imread 读取到是RGB,使用OpenCV进行转换
    """
    return cv2.cvtColor(img, cv2.COLOR_RGB2GRAY)

def canny(img, low_threshold, high_threshold):
    """功能:边缘检测 Canny transform"""
    return cv2.Canny(img, low_threshold, high_threshold)

def gaussian_blur(img, kernel_size):
    """功能:高斯模糊(除噪)"""
    return cv2.GaussianBlur(img, (kernel_size, kernel_size), 0)

def region_of_interest(img, vertices):
    """
    功能:选取图形区域
    只保留由 vertices 组成的多边形内的图像
    """
    #defining a blank mask to start with
    mask = np.zeros_like(img)

    #defining a 3 channel or 1 channel color to fill the mask with depending on the input image
    if len(img.shape) > 2:
        channel_count = img.shape[2]  # i.e. 3 or 4 depending on your image
        ignore_mask_color = (255,) * channel_count
    else:
        ignore_mask_color = 255

    #filling pixels inside the polygon defined by "vertices" with the fill color
    cv2.fillPoly(mask, vertices, ignore_mask_color)

    #returning the image only where mask pixels are nonzero
    masked_image = cv2.bitwise_and(img, mask)
    return masked_image


def draw_lines(img, lines, color=[255, 0, 0], thickness=2):
    """
    功能:把 lines 画到 img 上
    """
    for line in lines:
        for x1,y1,x2,y2 in line:
            cv2.line(img, (x1, y1), (x2, y2), color, thickness)

def hough_lines(img, rho, theta, threshold, min_line_len, max_line_gap):
    """
    功能:进行霍夫变换找出线段
    `img` 是 Canny transform 的输出
    输出结果是霍夫变换后找到的线段
    """
    lines = cv2.HoughLinesP(img, rho, theta, threshold, np.array([]), minLineLength=min_line_len, maxLineGap=max_line_gap)
    line_img = np.zeros((img.shape[0], img.shape[1], 3), dtype=np.uint8)
    draw_lines(line_img, lines)
    return line_img

def weighted_img(img, initial_img, α=0.8, β=1., λ=0.):
    """
    功能:将霍夫变换得到的线段 img 绘制到 原始图像 initial_img 上。
    输出图像由此计算:
    initial_img * α + img * β + λ
    img, initial_img 的形状(长宽/Channel数量)必须相同
    """
    return cv2.addWeighted(initial_img, α, img, β, λ)
定义一些针对寻找行车线所需的函数:
def slop(line):
    """
    功能:计算斜率
    input a line [x0, y0, x1, y1]
    return (y1-y0)/(x1-x0)
    """
    return 1.0*(line[3]-line[1])/(line[2]-line[0])


def get_side_lines(lines, min_slop=-5, max_slop=5):
    """
    功能:保留合理范围的斜线。从图像上看,行车线不太可能是水平的,可以去除这些不合理的斜线。
    input lines returned from hough
    output side lines that between the min_slop and max_slop.
    """
    side_lines = []

    for line in lines:
        if slop(line[0]) > min_slop and slop(line[0]) < max_slop:
            side_lines.append(line)

    return side_lines


def generate_result_line(lines, y_min = 330):
    """
    功能: 对左线/右线得到的所有有效线段进行平均,获得最终的左线/右线。
    比如左线,从hough中可以获得左线上的多条线段。首先求出这些线段的平均斜率,
    再根据平均斜率,把每一条线段向下延伸,得到这条线段大概的x轴起点位置,
    最后将这些线段延伸后的x轴起点位置进行平均,得到最终的x轴平均起点。
    从这个x轴平均起点,按照平均斜率,向上延伸得到最终左线。
    input left/right lines from get_side_lines().
    this function will average and extend them to
    y_min and output a result line.
    """

    # draw line from the image bottom
    y_max = 539

    # calculate the average slop
    sum_slop = 0.1
    sum_length = 0.1
    for line in lines:
        length = abs(line[0][2] - line[0][0])
        sum_length += length
        sum_slop += length * slop(line[0])
    avg_slop = sum_slop / sum_length

    # calculate the x_start (the x of lane start point)
    # base on avg_slop
    x_start_sum = 0
    x_start_count = 0
    x_start = 0
    for line in lines:
        x_start_sum += line[0][0] + (y_max - line[0][1]) / avg_slop
        x_start_sum += line[0][2] + (y_max - line[0][3]) / avg_slop
        x_start_count += 2
    if x_start_count > 0:
        x_start = x_start_sum / x_start_count


    # Calculate the x of end point
    x_end = x_start + (y_min - y_max) / avg_slop

    # return the line as np.array
    return np.array([[x_start, y_max, x_end, y_min]], dtype=np.int32)
对单张图片进行处理
将之前提到的功能组合起来,得到寻找行车线的pipeline:
彩色到灰度转换 -> 高斯模糊(除噪) -> Canny 边缘检测 -> 有效区域选择 -> 霍夫变换寻找线段 -> 根据斜率获取左右线 -> 计算最终左右线.
# import images
image = mpimg.imread('test_images/solidWhiteRight.jpg')

# Transform to grayscale
image_gray = grayscale(image)

# Gaussian blur
gaussian_kernel_size = 5
image_blur = gaussian_blur(image_gray, gaussian_kernel_size)

# Canny edges
canny_low_threshold = 90
canny_high_threshold = 270
image_edge = canny(image_blur, canny_low_threshold, canny_high_threshold)

# Mask for interest region.
upper_left = (450,280)
upper_right = (510, 289)
botton_left = (100, 539)
botton_right = (860, 539)
vertices = np.array([[botton_left, upper_left, upper_right, botton_right]], dtype=np.int32)
edge_masked = region_of_interest(image_edge, vertices)

# Filter lines by hough.
hough_rho = 2  # distance resolution in pixels of the Hough grid
hough_theta = np.pi/180 # angular resolution in radians of the Hough grid
hough_threshold = 30     # minimum number of votes (intersections in Hough grid cell)
hough_min_line_len = 20  #minimum number of pixels making up a line
hough_max_line_gap =  20    # maximum gap in pixels between connectable line segments
lines = cv2.HoughLinesP(edge_masked, hough_rho, hough_theta, hough_threshold, np.array([]), minLineLength=hough_min_line_len, maxLineGap=hough_max_line_gap)

# Get left lines
left_lines = get_side_lines(lines, -10, -0.2)

# Get right lines
right_lines = get_side_lines(lines, 0.2, 10)

# Average and extend left/right line.
merged_left_line = generate_result_line(left_lines)
merged_right_line = generate_result_line(right_lines)

# Draw line to a black image.
line_img = np.zeros((image.shape[0], image.shape[1], 3), dtype=np.uint8)
draw_lines(line_img, [merged_left_line, merged_right_line], thickness=8)

# Merge lines into the original image.
result_image = weighted_img(line_img, image)
plt.imshow(result_image)

处理视频
能处理单个图像,处理视频也就好说了。使用 VideoFileClip 可以对每一帧应用上面的pipeline进行处理。
首先定义一个 processimage 函数,以一帧图像作为输入,输出则是处理好的图像。将上述pipeline直接放到函数内即可。
def process_image(image):
    return result_image
from moviepy.editor import VideoFileClip
from IPython.display import HTML

white_output = 'white.mp4'
clip1 = VideoFileClip("solidWhiteRight.mp4")
white_clip = clip1.fl_image(process_image) #NOTE: this function expects color images!!
%time white_clip.write_videofile(white_output, audio=False)